








🌐 Documentation (all examples run on real public data)
- 📖 Documentation website: function reference and articles.
- 🚀 Getting started: per-study DE on airway (GSE52778) and a four-cohort Alzheimer’s meta-analysis in five minutes.
- 🧠 Case study: Alzheimer’s disease brain: 4 independent GEO cohorts (340 brains). Covers study selection and donor-overlap checks, model choice, heterogeneity and prediction intervals, leave-one-out robustness, and cross-study pathway meta-analysis.
- 🔁 Full workflow: from GEO accessions to an HTML report.
- 🧬 Downstream biology: TF activity, cell composition, consensus co-expression and drug reversal.
Overview
Most transcriptomic meta-analysis tools address only one part of the workflow — existing packages handle data harmonization or DE analysis or meta-statistics, but not the full pipeline. metaXpress closes this gap.
It provides a single end-to-end pipeline, from public or local counts to a validated, reported meta-analysis:
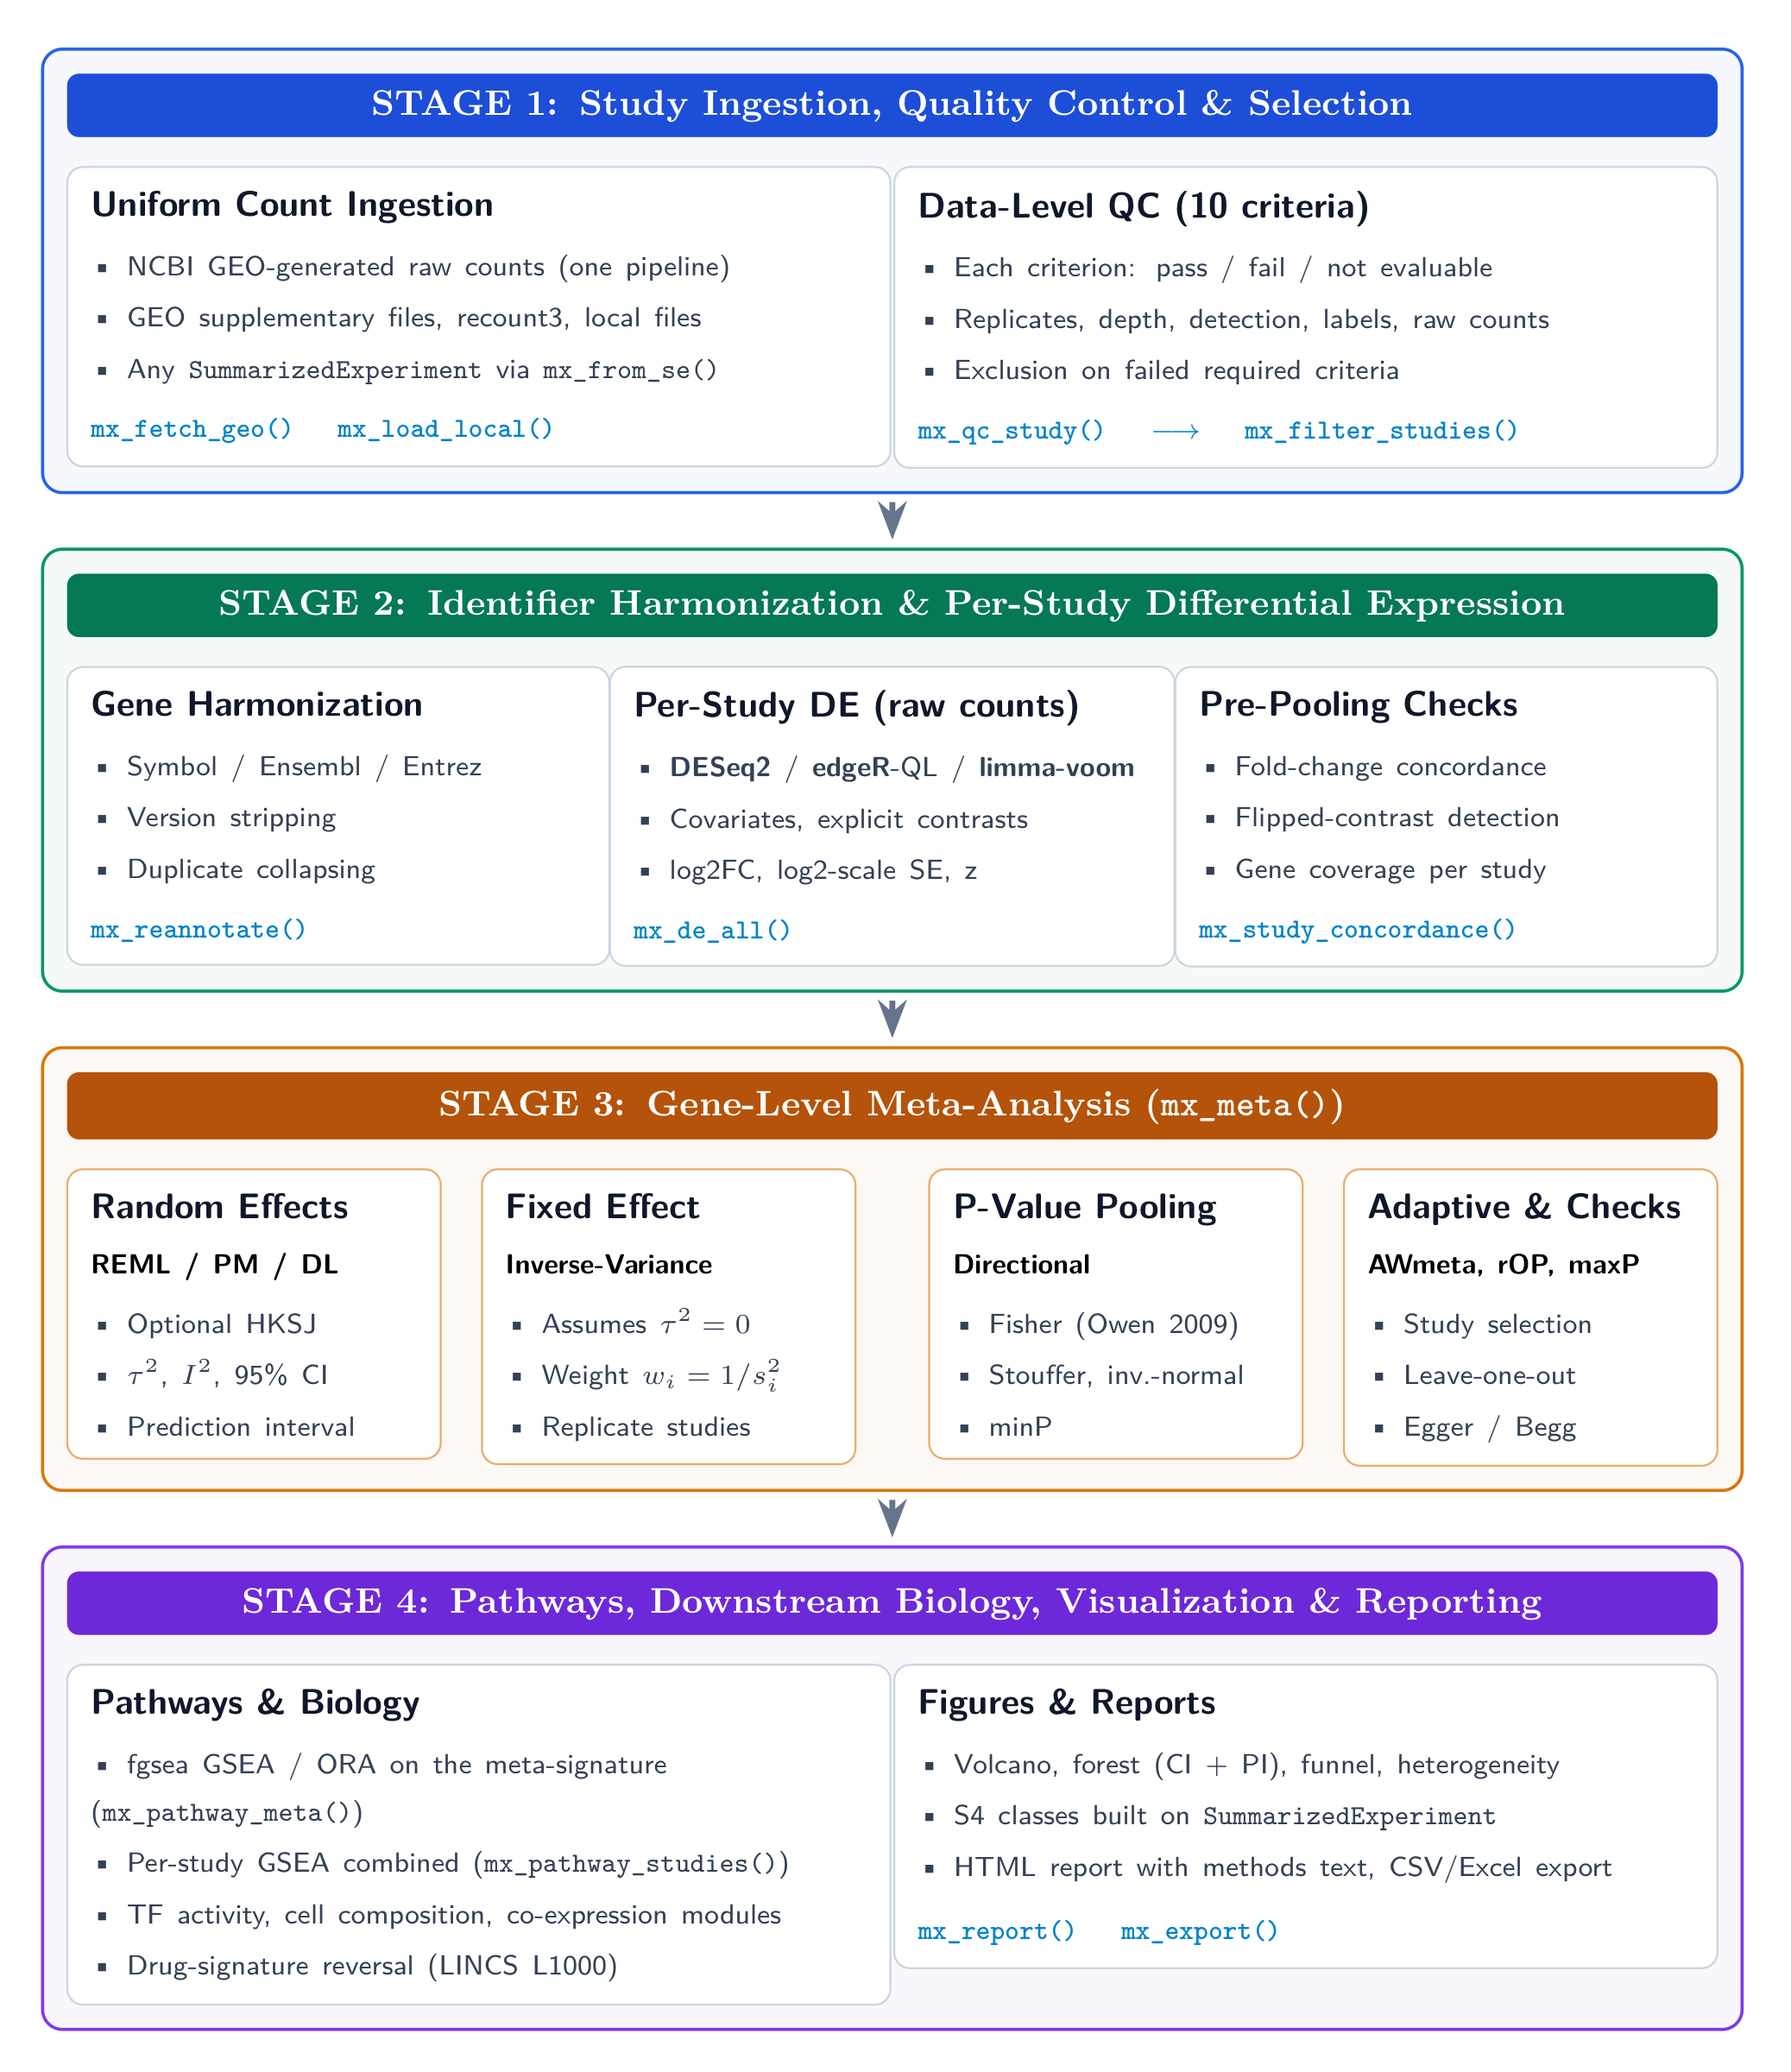
| Stage | What happens | Key functions |
|---|---|---|
| 1. Ingest & QC | Uniformly processed NCBI GEO counts, local files or any SummarizedExperiment. Ten QC criteria, each recorded as pass, fail or not evaluable |
mx_fetch_geo(), mx_load_local(), mx_from_se(), mx_qc_study(), mx_filter_studies()
|
| 2. Harmonize & per-study DE | Gene ID mapping. DESeq2 / edgeR / limma-voom on raw counts, with covariates and explicit contrasts. Fold-change concordance check |
mx_reannotate(), mx_de_all(), mx_study_concordance()
|
| 3. Meta-analysis | Random effects (REML / PM / DL, optional HKSJ), fixed effect, directional p-value methods, rOP, AWmeta. Heterogeneity, prediction intervals, leave-one-out, small-study tests |
mx_meta(), mx_sensitivity(), mx_small_study()
|
| 4. Interpret & report | GSEA / ORA, cross-study pathways, TF activity, cell composition, co-expression, drug reversal. Figures and HTML report |
mx_pathway_meta(), mx_pathway_studies(), mx_forest(), mx_report()
|
📦 Installation
Install metaXpress directly from GitHub:
# Install remotes if not already installed
if (!requireNamespace("remotes", quietly = TRUE)) {
  install.packages("remotes")
}

# Install metaXpress directly from GitHub
remotes::install_github("hossainlab/metaXpress")
Alternative Installation with pak
# install.packages("pak")
pak::pkg_install("hossainlab/metaXpress")🔬 Validation
Statistics are tested against reference implementations (tests/testthat):
-
Random effects. Pooled effect, SE, p-value, tau², Q and CI agree with
metafor::rma()to within 1e-7. This covers DerSimonian-Laird, REML and Paule-Mandel estimators, with and without Hartung-Knapp-Sidik-Jonkman. -
Per-study DE.
mx_de()reproduces native DESeq2 exactly on airway (GSE52778, paired design~ cell + condition). DESeq2, edgeR-QL and limma-voom log2FCs correlate at r ≥ 0.997, all with log2-scale SEs. - P-value methods. Fisher, Stouffer, weighted inverse-normal, minP, maxP and rOP are tested against their closed forms. The tests also confirm that opposite-direction effects do not accumulate.
Real-data case study: Alzheimer’s disease brain. Four independent GEO cohorts were analysed, all with NCBI uniformly processed counts:
| Cohort | Region | AD / control |
|---|---|---|
| GSE125583 | Fusiform gyrus | 218 / 70 |
| GSE104704 | Lateral temporal lobe | 12 / 10 |
| GSE53697 | Dorsolateral PFC | 6 / 6 |
| GSE173955 | Hippocampus | 8 / 10 |
GSE95587 and GSE159699 were excluded because their donors overlap with included cohorts. The random-effects REML meta-analysis recovers established AD biology:
- Up: GFAP, C4B, CD44.
- Down: VGF, BDNF, CRH, NPTX2, VIP.
- Pathways: loss of oxidative phosphorylation; gain of TNF-alpha/NF-kB and IL6/JAK/STAT3 signalling.
The leave-one-out analysis identifies a robust core of genes that survives the removal of any single cohort.
Why metaXpress?
Combining bulk RNA-seq studies is usually a patchwork: one package to download GEO data, ad-hoc scripts for QC and gene ID mapping, a separate DE run per study, another package for the meta-statistics, and yet another for pathways and plots. Each hand-off is a chance to silently drop genes, mix identifiers, or lose track of which study failed QC. metaXpress replaces that patchwork with one reproducible pipeline built on two S4 objects that pass cleanly from step to step.
-
One workflow, end to end. GEO ingestion → QC → harmonization → per-study DE → meta-analysis → pathways → figures → report, all through
mx_*functions that chain directly. - Study quality is explicit. A data-level QC checklist and a fold-change concordance check (which catches flipped contrasts) run before pooling.
- Uniform quantification. By default, counts come from NCBI’s GEO RNA-seq pipeline, so every study shares the same aligner, annotation and counting.
- Statistically sound by design. DE is always run independently per study (DESeq2, edgeR or limma-voom) before combining — never pooled — avoiding batch-confounded inference.
-
Choose the right meta-method. Nine methods (random effects with REML/PM/DL and optional HKSJ, fixed effect, directional Fisher, Stouffer, weighted inverse-normal, minP, maxP, rOP, AWmeta) behind one
methodargument. Every gene gets tau², I², a 95% CI and a prediction interval. Results are validated againstmetafor. -
Missing genes are handled, not hidden. Each gene is pooled over the studies that measured it, and
n_studiesis reported. Genes are never silently dropped in an intersect. - Biology, not just gene lists. fgsea GSEA/ORA on the meta-signature, per-study GSEA combined across studies, transcription factor activity, cell-composition meta-analysis, consensus co-expression modules and drug-reversal ranking turn meta-signatures into testable hypotheses.
- Publication-ready and reproducible. Volcano, forest, heatmap, UpSet and heterogeneity plots, plus HTML/PDF reports and CSV/Excel export with captured session info.
- Scales with BiocParallel. Per-study steps parallelize out of the box on laptops or clusters.
Quick Start
library(metaXpress)

# 1. Uniformly processed raw counts from GEO (NCBI pipeline)
studies <- mx_fetch_geo(
  c("GSE125583", "GSE104704", "GSE53697", "GSE173955"),
  condition_col = c(GSE125583 = "diagnosis:ch1", GSE104704 = "study group:ch1",
                    GSE53697 = "disease status:ch1", GSE173955 = "title"))

# 2. Per-study DE from raw counts, covariates and explicit contrasts
studies <- mx_de_all(studies, method = "DESeq2",
                     formula  = list(~ sex + condition, ~ condition,
                                     ~ condition, ~ condition),
                     contrast = list(c("Alzheimer's disease", "control"),
                                     c("Aged, diseased", "Old"),
                                     c("advanced Alzheimer's Disease", "control"),
                                     c("Alzheimer's Disease", "non-Alzheimer's Disease")))
de_results <- lapply(studies, function(s) s@de_result)

# 3. Check orientation, then pool (random effects, REML)
mx_study_concordance(de_results)
res <- mx_meta(de_results, method = "random_effects", tau_method = "REML")

# 4. Robustness, pathways, figures, report
loo <- mx_sensitivity(de_results, tau_method = "REML")
res <- mx_pathway_meta(res, db = "Hallmarks")          # fgsea GSEA
ps  <- mx_pathway_studies(de_results, db = "Hallmarks") # cross-study pathways
mx_volcano(res); mx_forest("GFAP", de_results, res)
mx_report(res, de_results, output_dir = "results")
The per-study results for these four cohorts ship with the package, so the analysis runs offline:
ad  <- readRDS(system.file("extdata", "ad_brain_de.rds", package = "metaXpress"))
res <- mx_meta(ad$de_results)
Meta-Analysis Statistical Methods
mx_meta() implements two families of methods. Effect-size models pool per-study log2 fold changes weighted by their sampling variance; p-value combination methods pool evidence without pooling effects and answer different hypotheses. The random-effects estimates (DL, REML, Paule-Mandel, with optional Hartung-Knapp-Sidik-Jonkman adjustment) are tested to agree with metafor::rma() to within 1e-7.
| Method | method = |
Hypothesis / estimand | Reference |
|---|---|---|---|
| Random effects (default) | "random_effects" |
Average log2FC across populations; reports tau², I², 95% CI and prediction interval | DerSimonian & Laird 1986; Viechtbauer 2005; IntHout et al. 2014 |
| Fixed (common) effect | "fixed_effects" |
Single shared log2FC (studies are near-replicates) | Borenstein et al. 2010 |
| Fisher (directional) | "fisher" |
Effect in a common direction in ≥1 study | Fisher 1932; Owen 2009 |
| Stouffer | "stouffer" |
Signed Z-score combination, equal weights | Stouffer et al. 1949 |
| Weighted inverse-normal | "inverse_normal" |
Signed Z-score combination weighted by √n | Marot et al. 2009; Rau et al. 2014 |
| Tippett minP | "minp" |
DE in at least one study | Tippett 1931 |
| Wilkinson maxP | "maxp" |
DE in all studies | Wilkinson 1951 |
| r-th ordered p (rOP) | "rop" |
DE in at least r studies | Song & Tseng 2014 |
| AWmeta | "awmeta" |
AW-Fisher p-value with per-gene study selection + REML effect over selected studies | Li & Tseng 2011; Huo et al. 2020; Hu et al. 2026 |
Choosing a method. Pick the method a priori from the scientific question, not from the number of significant genes it returns:
-
Consensus disease signature (most common):
"random_effects"withtau_method = "REML". Report I², tau² and the prediction interval. With fewer than ~5 studies considerhksj = TRUE, which gives better-calibrated confidence intervals. -
Studies are technical replicates of one design:
"fixed_effects". -
No usable standard errors (e.g. only p-values published):
"inverse_normal"(with sample sizes) or"stouffer". -
Genes changed in all, or in most, studies:
"maxp"or"rop". -
Which studies drive each gene:
"awmeta"reports the AW-selected studies per gene (aw_studies).
Before pooling, run mx_study_concordance(). A negative fold-change correlation between two studies almost always means their case/control contrast is flipped. After pooling, run mx_sensitivity() for a leave-one-out robustness table.
S4 Data Structures
Two classes carry data through the pipeline:
| Class | Created by | Contains |
|---|---|---|
metaXpressStudy (extends SummarizedExperiment) |
mx_fetch_geo(), mx_load_local(), mx_from_se()
|
raw counts assay, sample colData (with condition), gene rowData, accession, organism, qc_score, per-study de_result after mx_de()
|
metaXpressResult |
mx_meta() |
meta_table (pooled log2FC, SE, CI, prediction interval, p / FDR, tau², I², direction consistency), method, n_studies, heterogeneity, pathway_result
|
Study QC
mx_qc_study() records each of 10 data-level criteria as pass, fail or not evaluable. Alignment, rRNA and duplicate metrics, for example, are rarely deposited in GEO. qc_score is the number of criteria passed. It is never rescaled, so missing information cannot inflate it. mx_filter_studies() decides on failures. By default it excludes a study that fails a criterion required for valid count-based DE: replicates, condition labels or raw counts. The thresholds are metaXpress defaults informed by Schurch et al. (2016). Assess study-level reporting quality separately, e.g. with the tool of Heberle et al. (2024).
| # | Criterion | Pass if | Evaluable when |
|---|---|---|---|
| 1 | Sample size | ≥ 3 samples per group | always |
| 2 | Sequencing depth | median assigned reads ≥ 10M | always |
| 3 | Alignment rate | mean ≥ 70% |
alignment_rate in colData |
| 4 | rRNA contamination | mean < 10% |
rrna_fraction in colData |
| 5 | Duplicate rate | mean < 50% |
duplicate_rate in colData |
| 6 | Gene detection | ≥ min_genes (15,000) genes in ≥ 50% of samples |
always |
| 7 | Condition labels | every sample labelled | always |
| 8 | Clear contrast | exactly 2 condition levels | always |
| 9 | Batch confounding | batch not aliased with condition | multi-level batch column |
| 10 | Raw counts | non-negative integers, max > 1,000 | always |
Function Reference
Module 1 — Data Ingestion & QC
| Function | Description |
|---|---|
mx_fetch_geo(accessions, condition_col) |
NCBI uniformly processed raw counts + metadata from GEO |
mx_fetch_sra(srp_ids) |
Fetch from SRA via recount3
|
mx_load_local(count_paths, metadata_paths) |
Load user-supplied files |
mx_qc_study(study) |
10 data-level criteria: pass / fail / not evaluable |
mx_cluster_samples(study) |
Suggest groups from metadata text (new cluster column) |
mx_filter_studies(studies, required) |
Remove studies failing required QC criteria |
Module 2 — Normalization & Harmonization
| Function | Description |
|---|---|
mx_reannotate(studies, org, target_id) |
Human / mouse / rat or custom mapping; strips Ensembl versions; collapses duplicates (max-mean / sum / drop) |
mx_normalize(study, method) |
TMM / VST / CPM / TPM / quantile into a new assay (raw counts kept) |
mx_correct_library_type(studies) |
polyA vs rRNA-depleted correction |
mx_remove_batch(studies, method) |
ComBat-seq / ComBat / limma, preserving condition; new assay, for pooled visualisation only |
mx_align_genes(studies) |
Restrict to common gene universe |
Module 3 — Per-Study DE
| Function | Description |
|---|---|
mx_de(study, method, formula) |
DESeq2 / edgeR / limma-voom on one study |
mx_de_all(studies, method, BPPARAM) |
Parallel DE across all studies |
mx_de_summary(studies) |
n DEGs per study summary table |
Module 4 — Meta-Analysis Statistics
| Function | Description |
|---|---|
mx_meta(de_results, method, tau_method, hksj) |
Random/fixed effects, directional Fisher, Stouffer, inverse-normal, minP, maxP, rOP, AWmeta |
mx_study_concordance(de_results) |
Pairwise fold-change concordance; flags flipped contrasts |
mx_heterogeneity(de_results) |
I², Q-stat, τ² per gene |
mx_sensitivity(de_results) |
Leave-one-out analysis with a robustness table |
mx_small_study(de_results) |
Per-gene Egger / Begg small-study (publication bias) tests |
Module 5 — Missing Gene Handling
| Function | Description |
|---|---|
mx_missing_summary(de_results) |
Gene × study coverage matrix |
mx_impute(de_results, method) |
exclude / mean / KNN / weighted |
mx_filter_coverage(de_results, min_studies) |
Filter by study coverage |
Module 6 — Pathway Meta-Analysis
| Function | Description |
|---|---|
mx_gene_sets(db, id_type) |
MSigDB collections (Hallmarks, Reactome, KEGG MEDICUS, WikiPathways, GO BP) |
mx_pathway_meta(meta_result, db) |
fgsea GSEA (signed meta z) or direction-split ORA on the meta-signature |
mx_pathway_studies(de_results, db) |
Per-study GSEA combined across studies (directional Stouffer) |
mx_pathway_consensus(pathway_results) |
Pathways significant across majority of studies |
mx_pathway_dedup(pathway_results) |
Remove redundant pathways |
mx_pathway_heatmap(pathway_results) |
Cross-study pathway heatmap |
Module 7 — Visualization
| Function | Description |
|---|---|
mx_volcano(meta_result) |
Meta-analysis volcano plot |
mx_forest(gene, de_results) |
Forest plot with I² for a single gene |
mx_heatmap(meta_result, studies) |
Top DEG heatmap across studies |
mx_upset(de_results) |
UpSet plot of DEG overlap |
mx_study_overview(studies) |
QC metrics summary plot |
mx_heterogeneity_plot(meta_result) |
I² distribution histogram |
Module 8 — Reporting & Export
| Function | Description |
|---|---|
mx_report(meta_result, de_results, format) |
HTML / PDF report with methods text, CIs, PIs, robustness |
mx_export(meta_result, format) |
Export CSV / Excel / RDS |
mx_session_info() |
Capture session info for reproducibility |
Module 9 — Downstream Biology
| Function | Description |
|---|---|
mx_tf_activity(meta_result, network) |
TF activity from target-gene changes (ULM; CollecTRI/DoRothEA) |
mx_cell_composition(studies, markers) |
Cross-study meta-analysis of cell-type composition shifts |
mx_coexpression_modules(studies) |
Consensus co-expression modules with pooled eigengene effects |
mx_drug_connectivity(meta_result, signatures) |
Rank drugs that reverse the meta-signature (LINCS/CMap) |
mx_read_signatures(path) |
Read up/down drug signatures from GMT / Enrichr libraries |
mx_downstream_plot(x) |
Ranked bar plot for any downstream result |
Citation
If you use metaXpress in your research, academic applications, or benchmarking, please cite:
@manual{metaXpress2026,
  title  = {metaXpress: End-to-End Bulk RNA-seq Meta-Analysis},
  author = {Hossain, Md. Jubayer},
  year   = {2026},
  note   = {R package version 0.99.0},
  url    = {https://mdjubayerhossain.com/metaXpress/}
}Key References
| Method | Reference |
|---|---|
| RNA-seq differential meta-analysis | Rau, Marot & Jaffrézic (2014) BMC Bioinformatics 15:91 |
| Random effects / tau² estimators | DerSimonian & Laird (1986); Viechtbauer (2005); Veroniki et al. (2016) |
| Hartung-Knapp-Sidik-Jonkman | IntHout, Ioannidis & Borm (2014) BMC Med Res Methodol 14:25 |
| Prediction intervals | Higgins, Thompson & Spiegelhalter (2009) JRSS A 172:137 |
| Directional Fisher (Pearson) test | Owen (2009) Ann Stat 37:3867 |
| r-th ordered p-value | Song & Tseng (2014) Ann Appl Stat 8:777 |
| Missing gene handling | Villatoro-García et al. (2022) Mathematics 10:3376 (DExMA) |
| Library-type correction | Bush et al. (2017) BMC Bioinformatics 18:301 |
| Study-quality assessment | Heberle et al. (2024) bioRxiv doi:10.1101/2024.11.07.622520 |
| AW-Fisher / AWmeta | Li & Tseng (2011) Ann Appl Stat 5:994; Huo et al. (2020) Bioinformatics 36:524; Hu et al. (2026) Curr Issues Mol Biol 48:530 |
| Small-study effects | Egger et al. (1997) BMJ 315:629; Begg & Mazumdar (1994) Biometrics 50:1088 |
License
MIT © Md. Jubayer Hossain