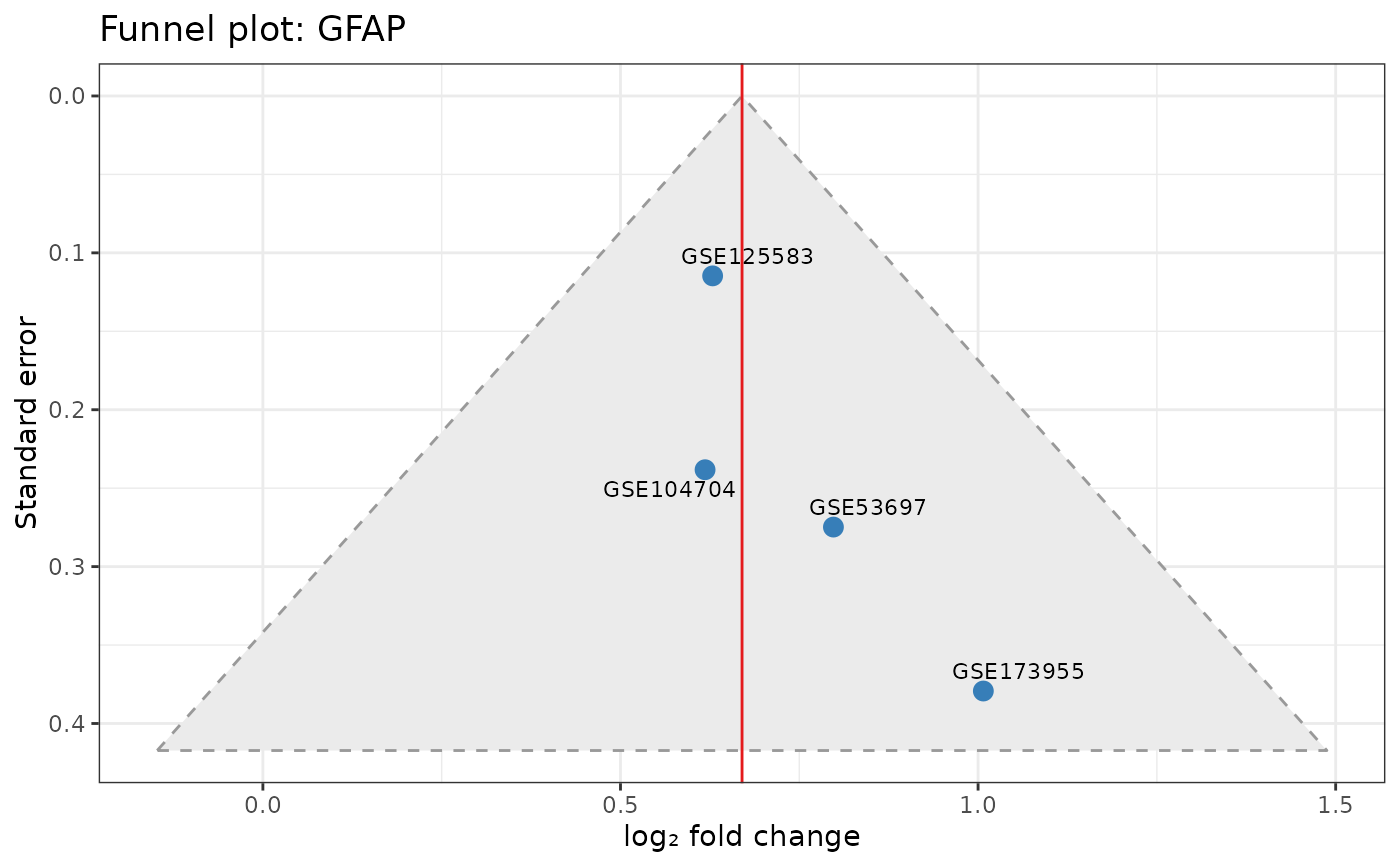
Plots each study's log2 fold change against its standard error, with the
pooled estimate and pseudo 95% confidence limits. Asymmetry suggests
small-study effects; see mx_small_study for formal tests.
Arguments
- gene
Gene identifier.
- de_results
Named list of per-study DE
data.frames ormetaXpressStudyobjects.- meta_result
Optional
metaXpressResult; its pooled estimate is used as the funnel centre. Otherwise the inverse-variance fixed-effect estimate is used.
References
Sterne, J.A.C. & Egger, M. (2001) Funnel plots for detecting bias in meta-analysis: guidelines on choice of axis. Journal of Clinical Epidemiology, 54(10), 1046–1055. doi:10.1016/S0895-4356(01)00377-8
Examples
ad <- readRDS(system.file("extdata", "ad_brain_de.rds",
                          package = "metaXpress"))
mx_funnel("GFAP", ad$de_results)